


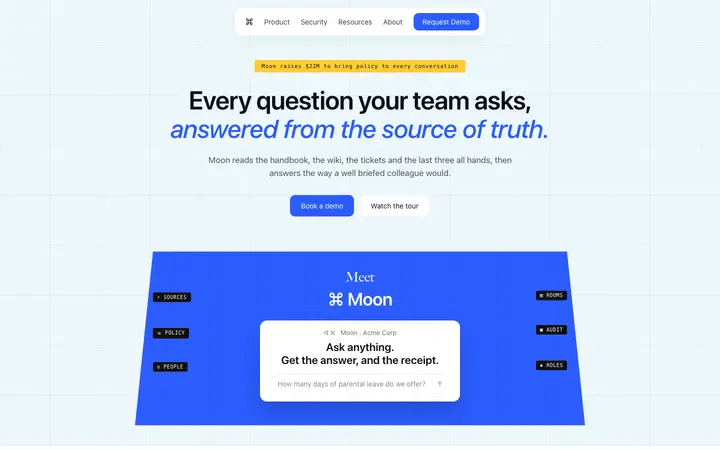
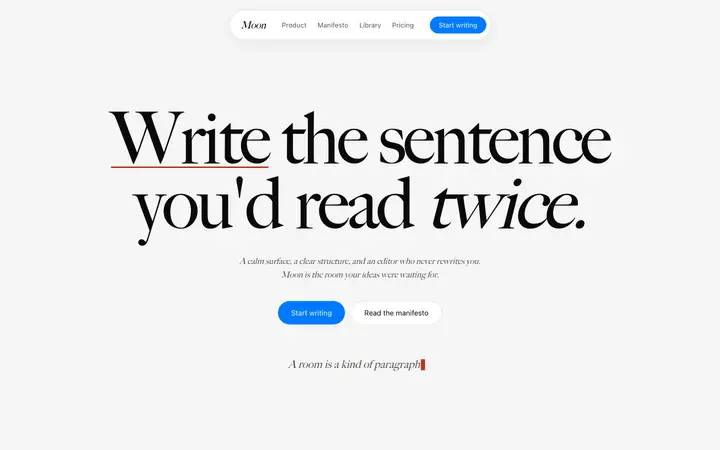
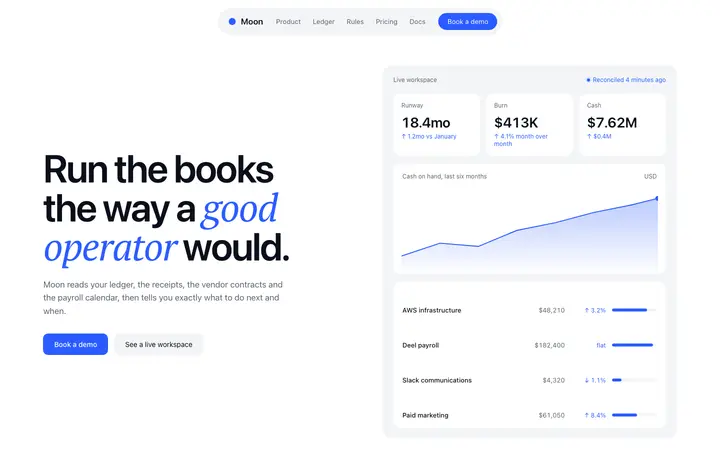

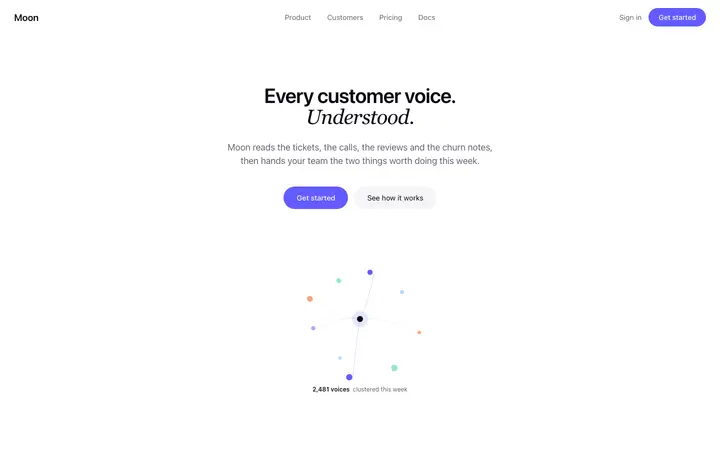
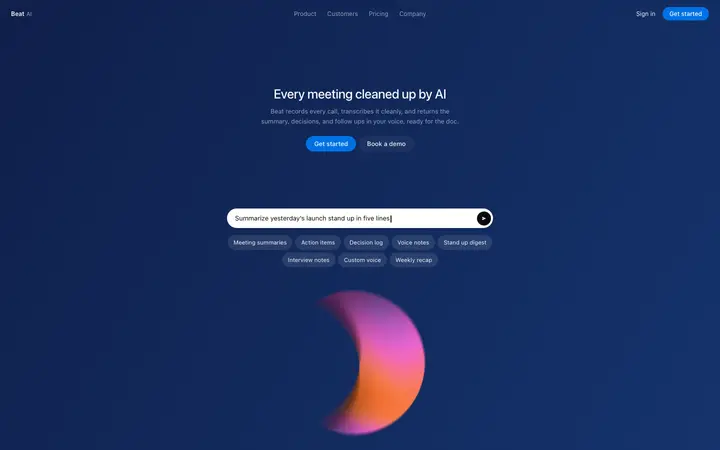
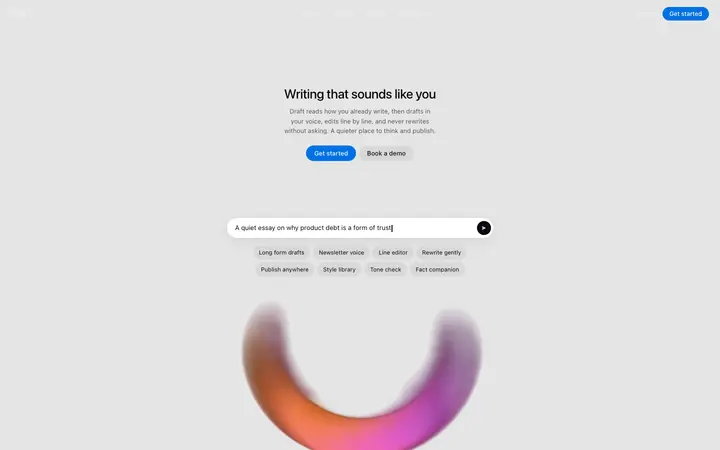
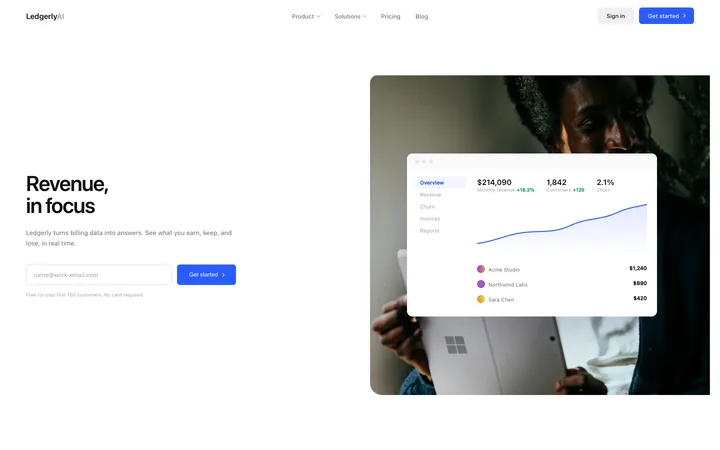
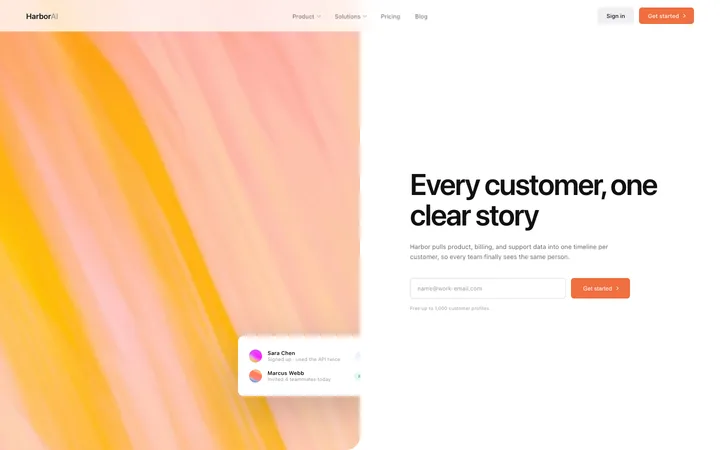
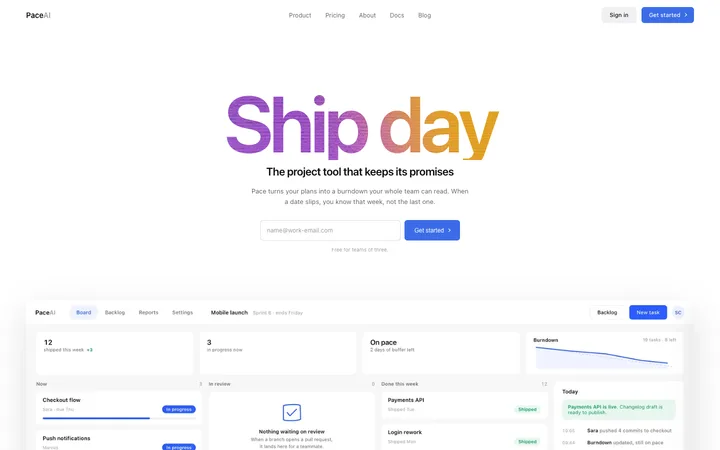
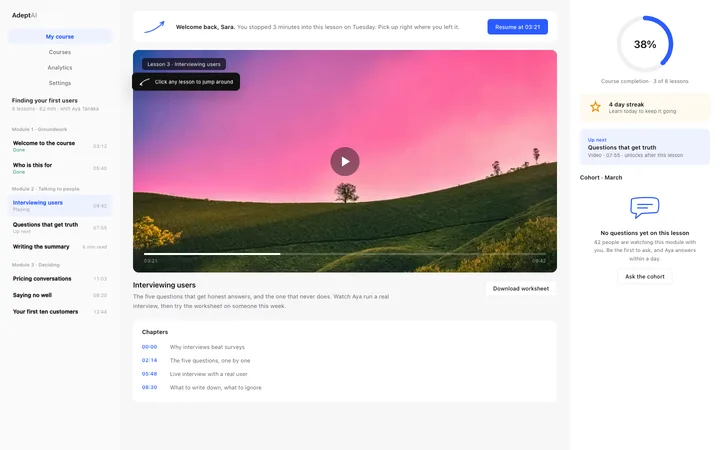
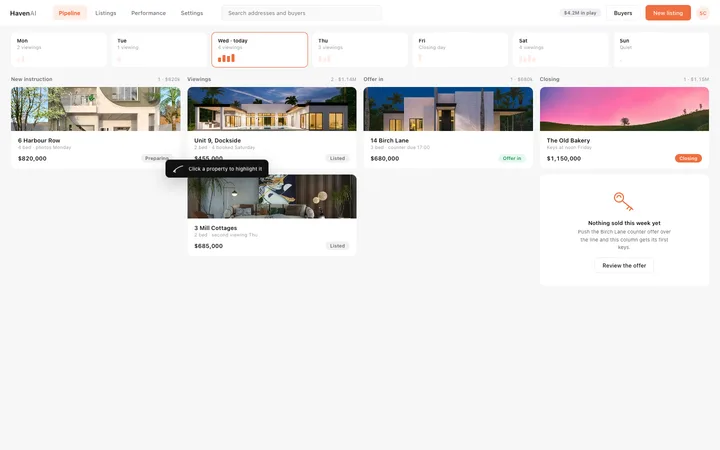
Made with $400/hour designers
Ship a site built for conversion from first impression.
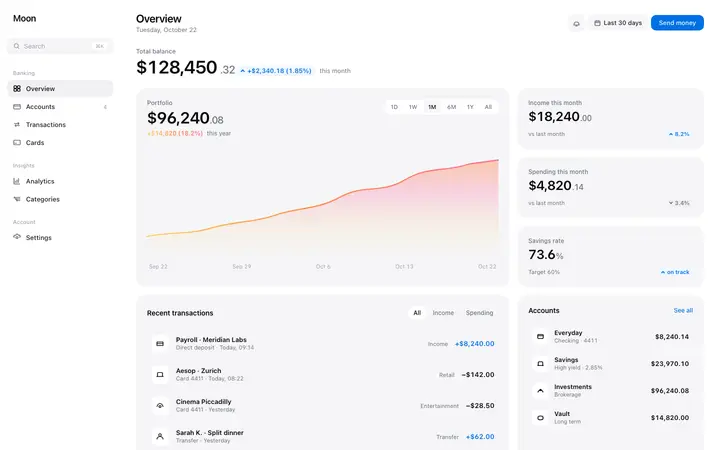
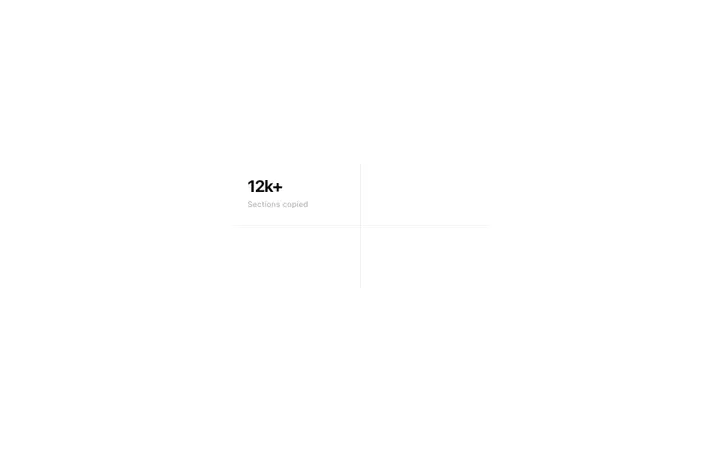
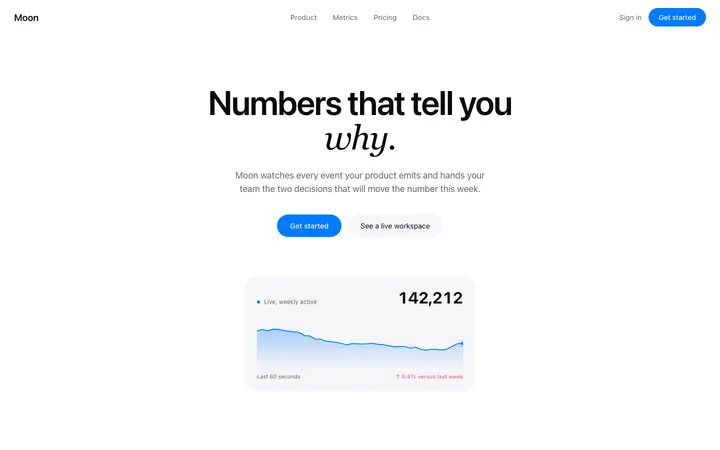
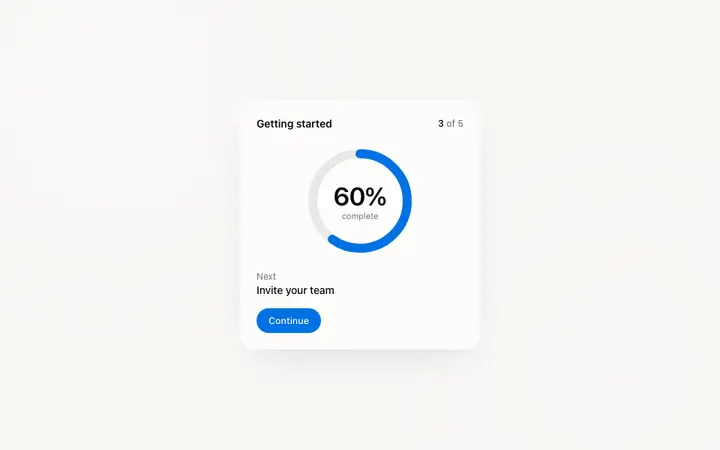
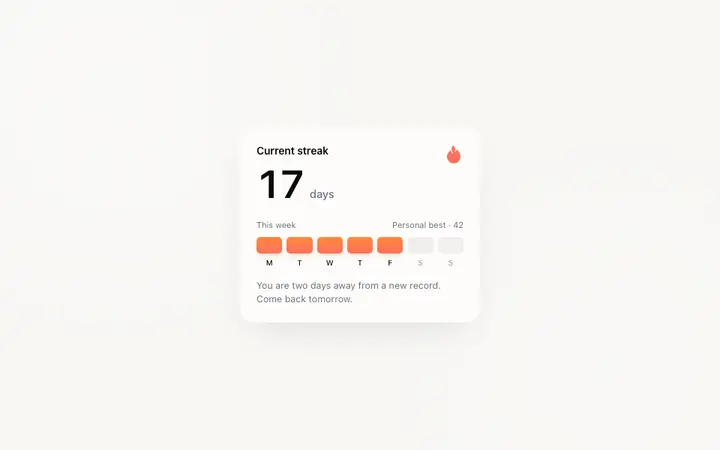
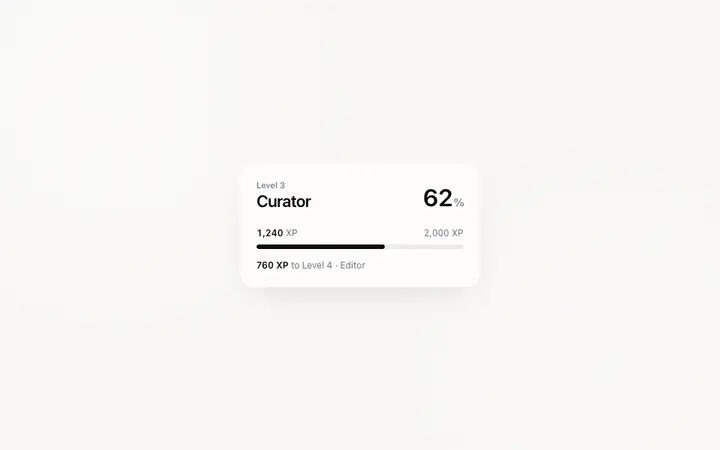
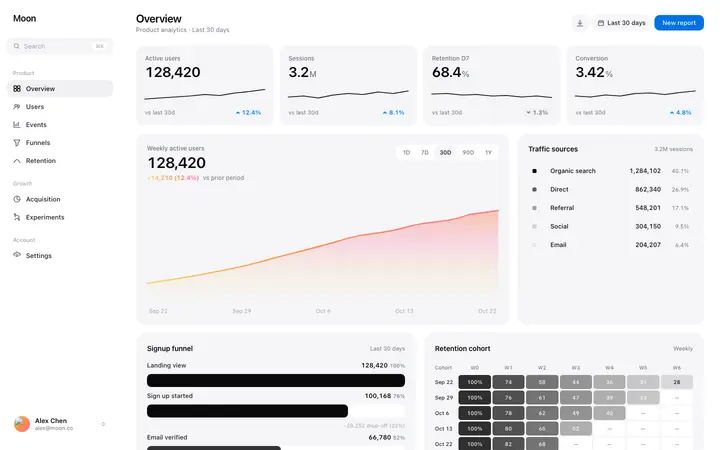
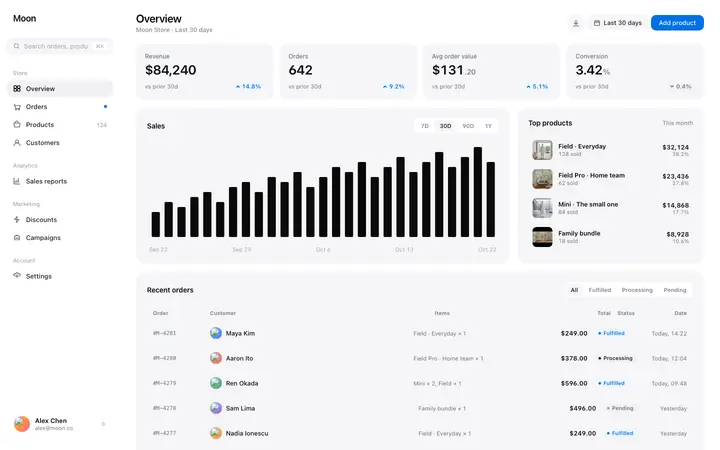
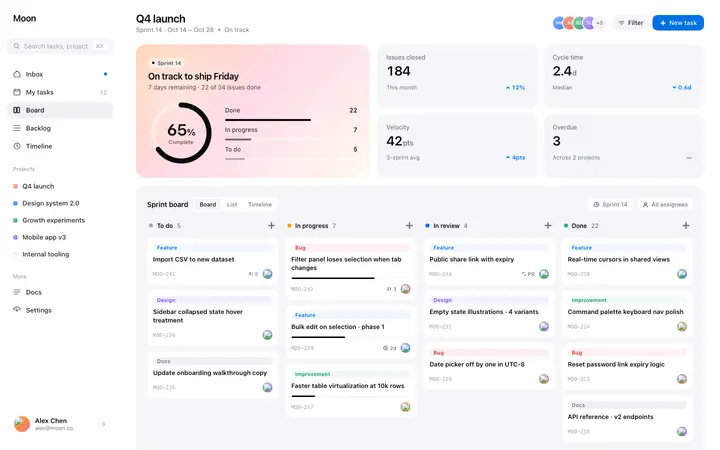
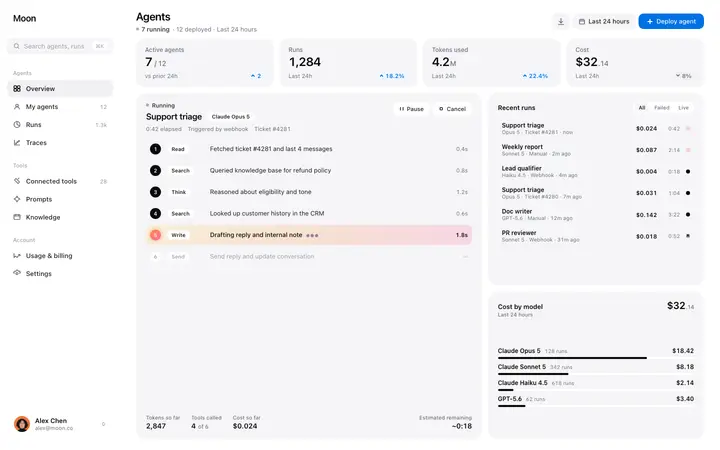
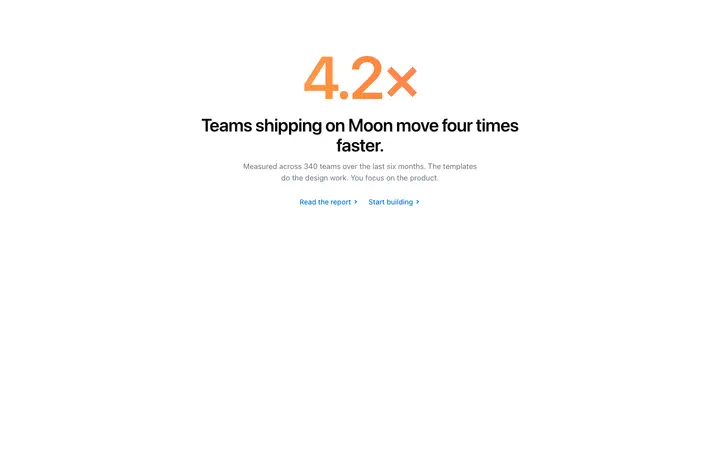
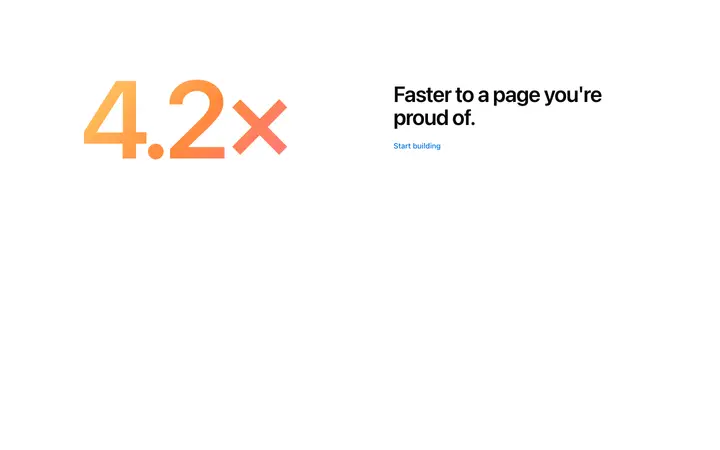
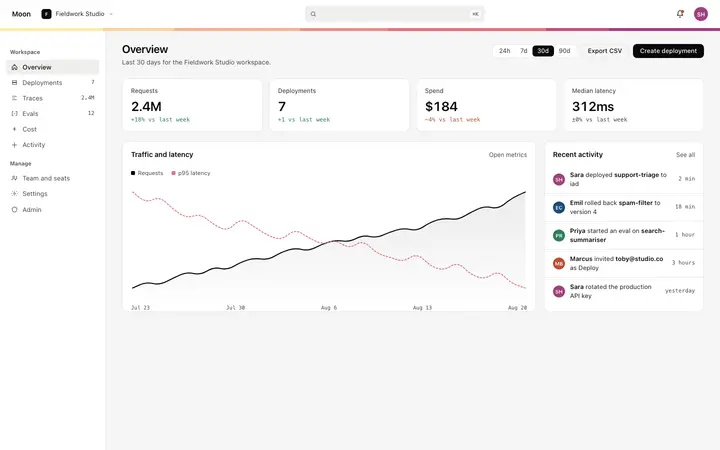
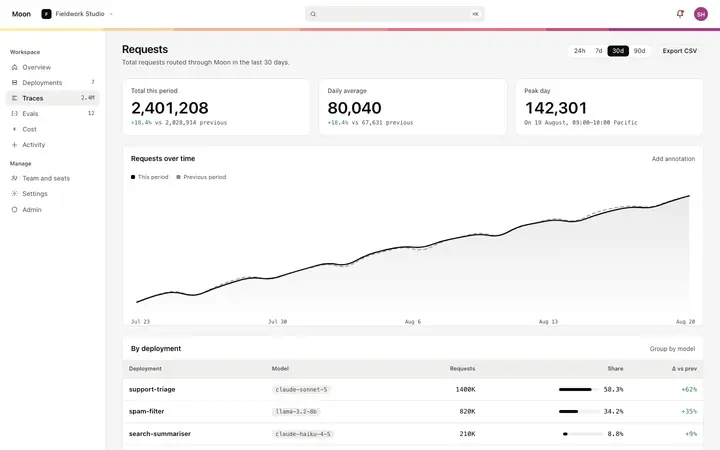
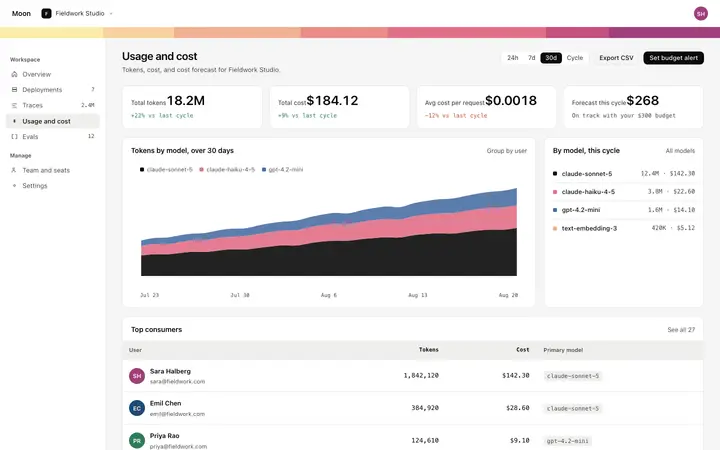
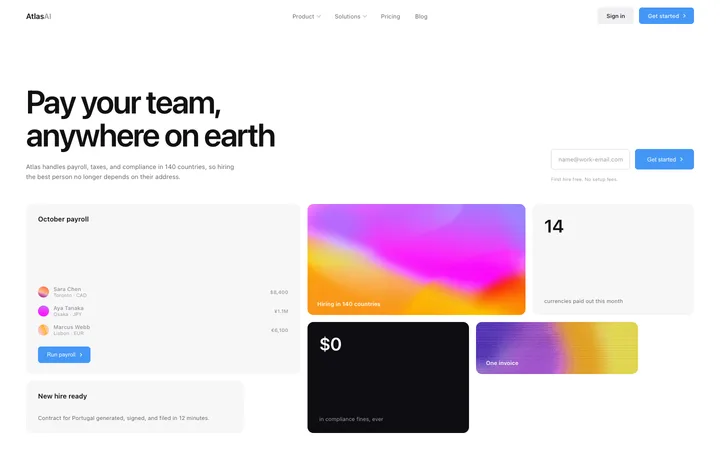
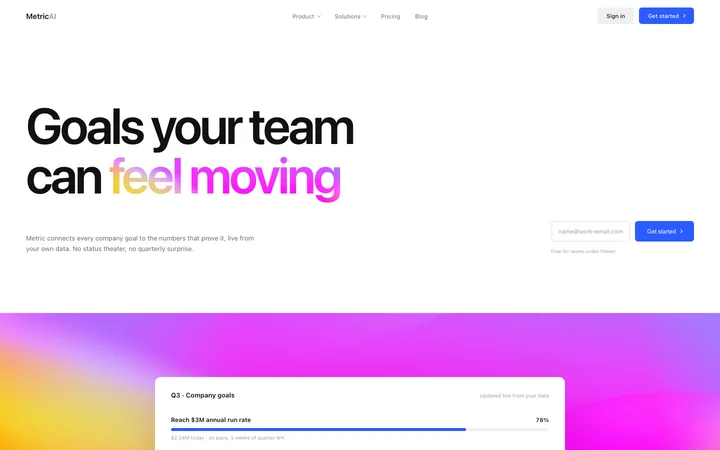
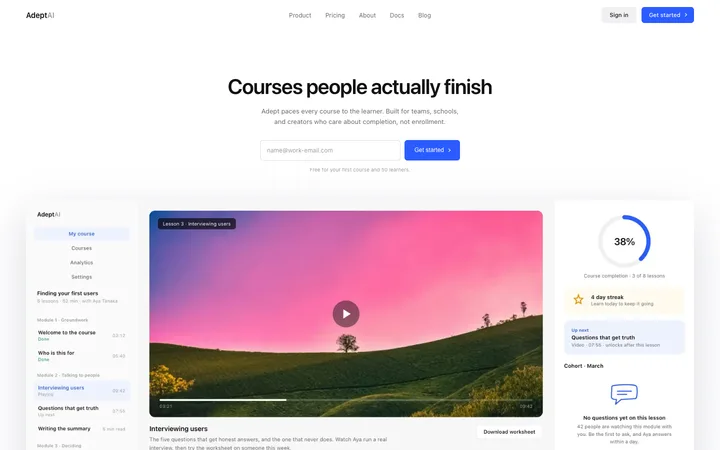
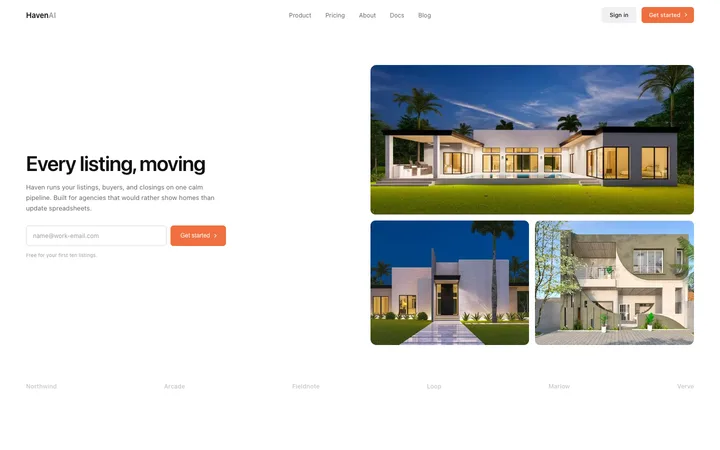
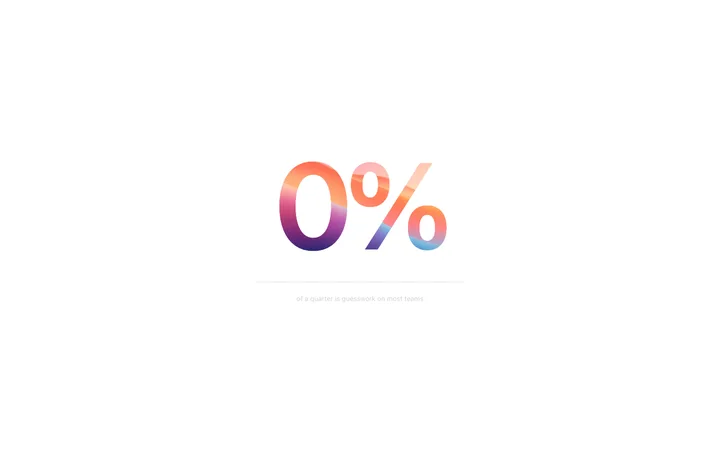
Stats section templates for SaaS websites: counters that animate on scroll, metric rows, result cards and the numbers a case study is built on. Every one is a single HTML file with no framework and no build step, so paste it into Claude Code, Replit, Lovable, ChatGPT Codex, Bolt, or Cursor and put your own figures in.
Ship a site built for conversion from first impression.
Frequently asked questions
Which numbers belong on a SaaS landing page?
The ones a buyer would check. Scale figures answer whether you are real, and result figures answer whether you work, and the second kind converts harder.
How many stats should a section show?
Three or four. A row of eight reads as a search for something impressive, not a claim you stand behind.
Should stat counters animate?
A short count on first scroll draws the eye to numbers that are easy to skip. Keep it brief, and make sure the final figure is what stays on screen.
What if the numbers are small?
Use a ratio or a result, not a total. Time saved per week or a percentage moved says more than a customer count you would rather not print.
Narrow it down
Works with any vibe coding tool