Streak calendar template for SaaS apps
Interactive streak calendar template for SaaS apps. Apple-like design. Use this AI template with Claude Code, Replit, Lovable, ChatGPT Codex, Bolt, Cursor, or another coding tool.
About this vibe coding template
Interactive streak calendar template for SaaS apps and gamified developer tools. A dedicated streak tracking page designed for a year of daily activity visible at a glance. The headline component is an activity heatmap spanning the last 52 weeks: a calendar grid with one column per week and one row per day of the week. Each cell fills with one of five intensity levels from empty to darkest, showing how much activity the user logged on that day. An activity summary line above the heatmap shows the total number of active days and the average actions per active day for the full period. Apple-like design. Describe your product, your audience, and your offer, and your coding tool fills in the copy and the images.
Build a full SaaS gamification and rewards system with this template design
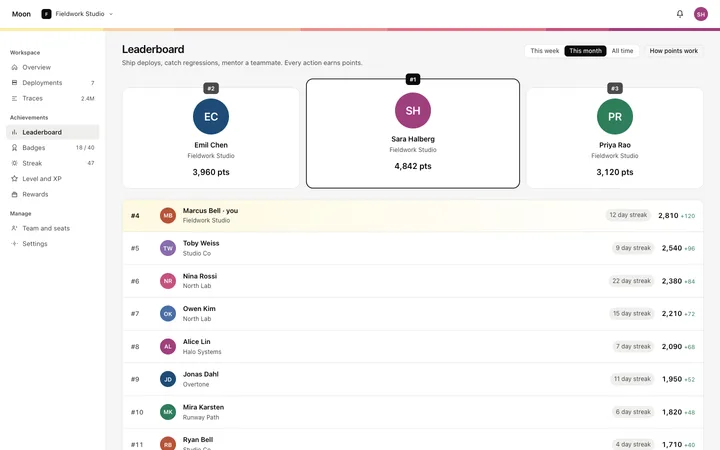
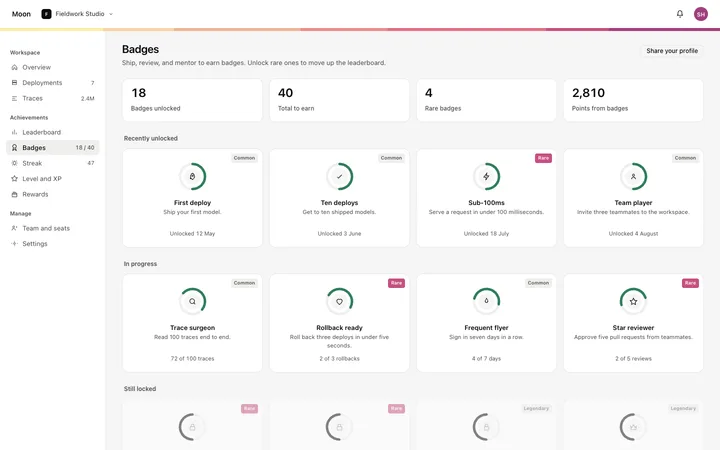
A SaaS gamification system puts points, streaks, badges, and leaderboards across a product, so one gamification template can set the standard for every screen after it. Copy the template, paste it into Claude Code, Replit, Lovable, ChatGPT Codex, Bolt, or Cursor, and send this alongside it.
Paste into Claude Code, Replit, Lovable, Bolt, or Cursor
Common questions about this template
What does this streak calendar template include?
Two stat cards for the current daily streak and the longest streak ever, an activity heatmap spanning the last 52 weeks with day of week labels, a five level color intensity scale, and an active days summary, a milestone strip showing completed and upcoming streak targets, and a freeze streak button.
How is this streak calendar different from the streak tracker template in the library?
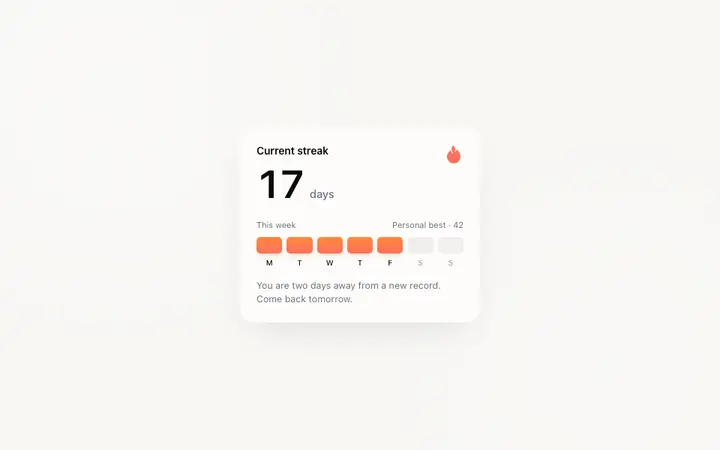
The streak tracker template is a compact widget for consumer SaaS showing the current streak count and recent activity in a small card. The streak calendar is a full page designed for the activity heatmap as the primary visual, making a full year of daily activity visible alongside milestone targets and the longest ever record. Different scale, different audience moment.
How does the activity heatmap work in this calendar template?
The heatmap is a grid with one column per week and one row per day of the week, covering the last 52 weeks. Each cell fills with one of five intensity levels based on the activity count for that day. Empty days use a light background; the most active days use the darkest color in the scale. A legend at the bottom explains each level.
How do streak milestones work in this calendar template?
The milestone strip lists streak targets in day increments. Completed milestones show a filled indicator and an unlocked label. The current milestone shows a you are here marker with today's count. Upcoming milestones show the days remaining. Replace the thresholds and reward descriptions with the milestones in your own gamification system.
Which tools work with this streak calendar template?
Claude Code, Replit, Lovable, ChatGPT Codex, Bolt, and Cursor. Paste it in and replace the heatmap cell values, stat card numbers, and milestone thresholds with your own streak data.
How do I build a full SaaS gamification and rewards system with this template?
Use this template as the first page of the SaaS gamification and rewards system, then ask your AI coding tool for the rest. Claude Code, Replit, Lovable, Bolt, and Cursor can all read the design and repeat it across the rest of your pages.
Use this AI coding template for
- ·Streak calendar template with 52 week activity heatmap for SaaS gamification
- ·Daily streak tracking page template with heatmap and milestones for a gamified SaaS app
- ·Activity heatmap calendar template for a SaaS product or developer tool
- ·Vibe coding streak calendar template
Works with every vibe coding tool
More gamification templates
View all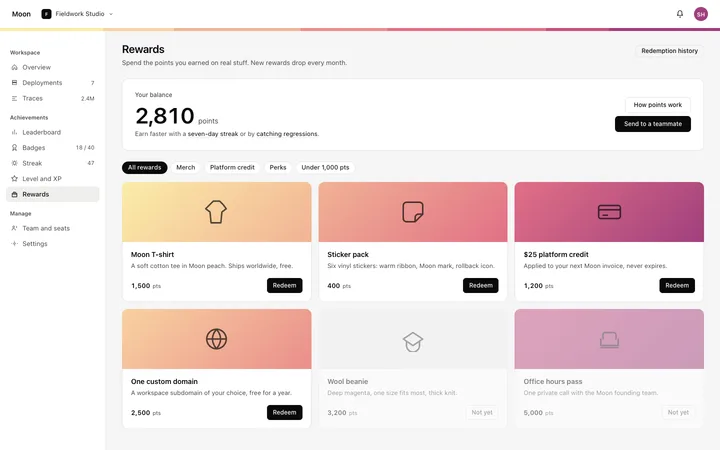
More vibe coding SaaS templates
View all
Other templates you might like