Lovable stats templates for AI websites and apps
Real stats designs you can copy into Lovable. Lovable turns a pasted template into a React app styled with Tailwind CSS and shadcn/ui components. Below: the designs, how to set Lovable up so it keeps the design, and what makes a good stats section.
Lovable stats templates
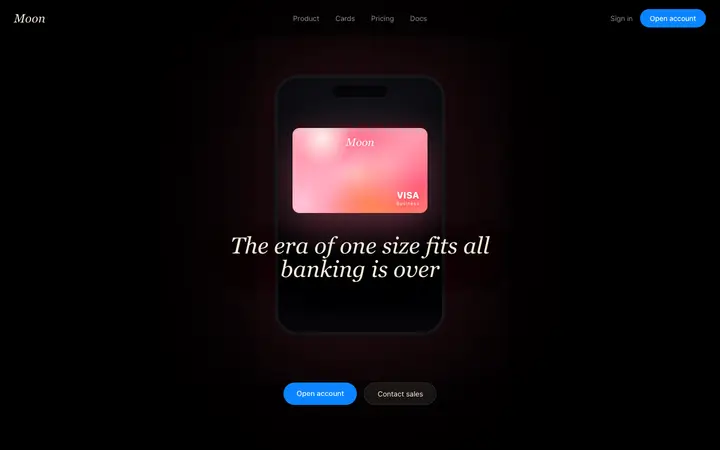
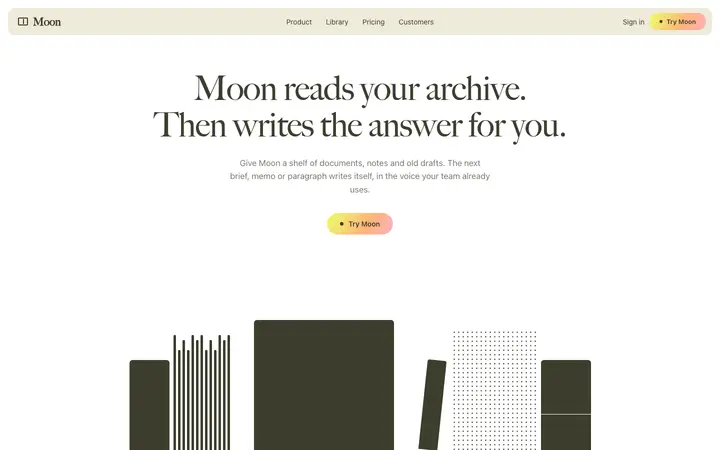
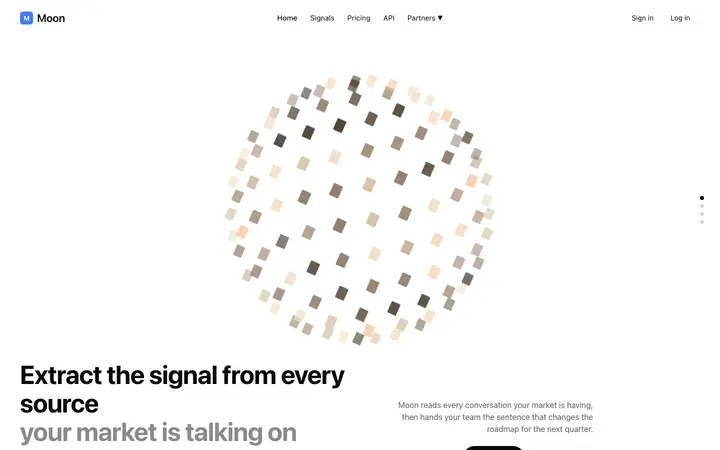
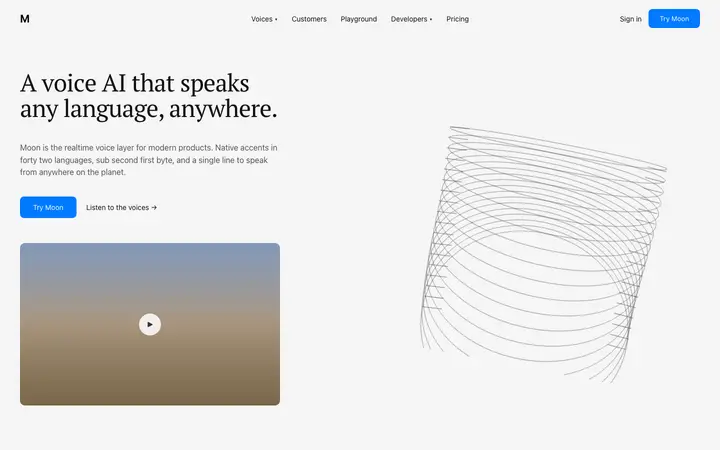
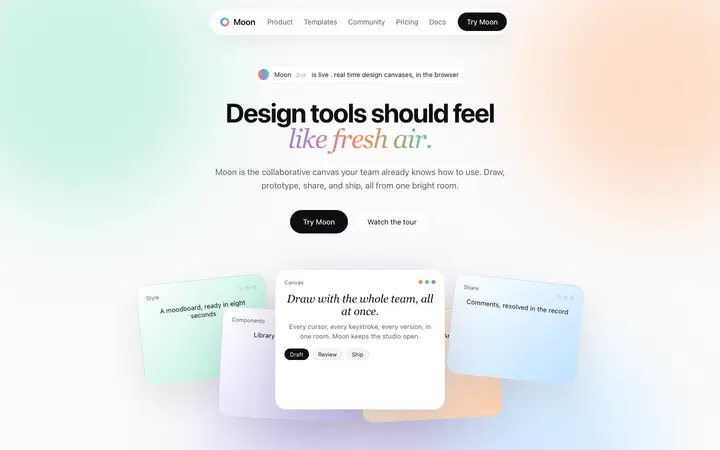
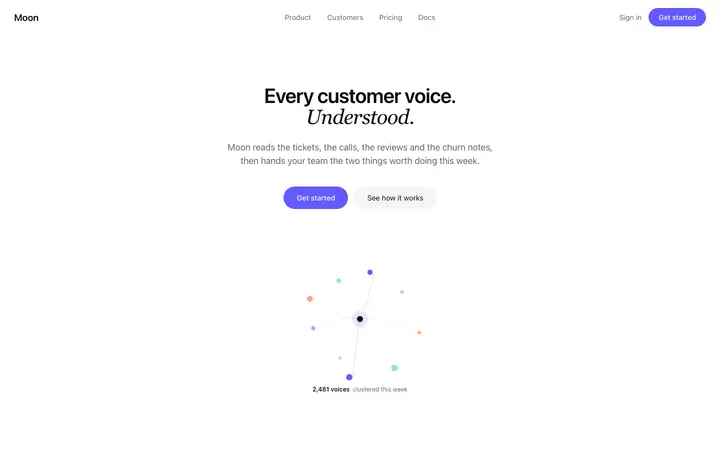
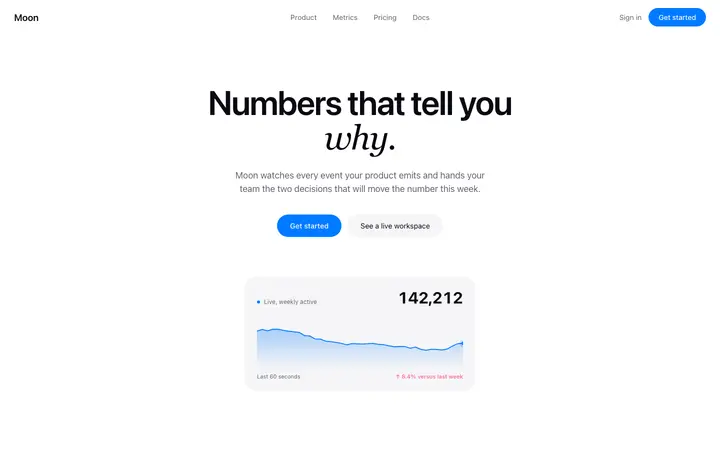
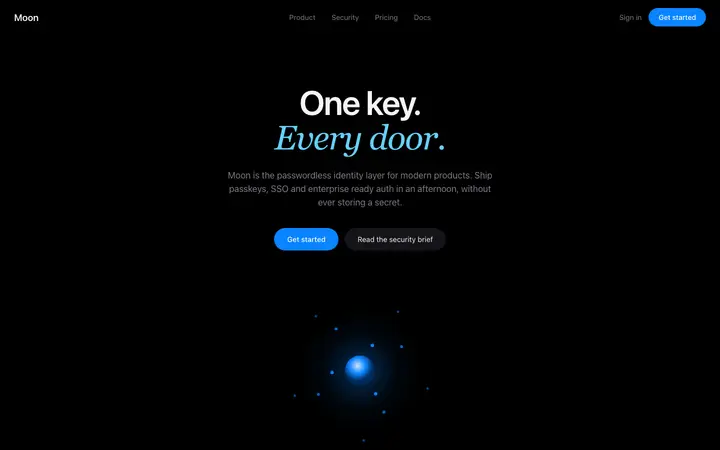
62 stats design templates for Lovable. Browse the full BrowserMoon library for every template category.
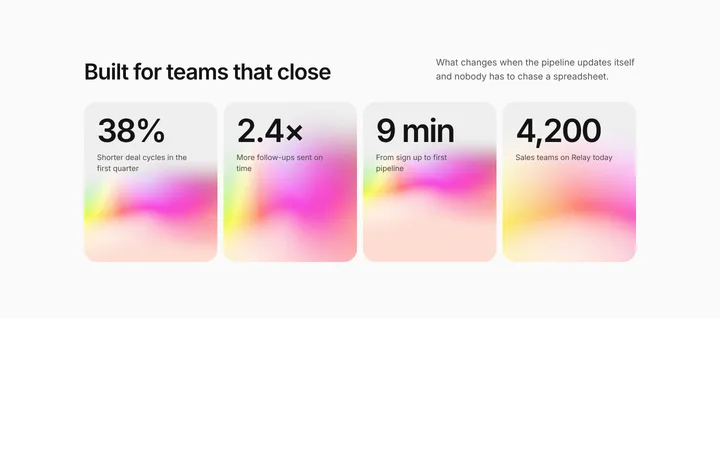
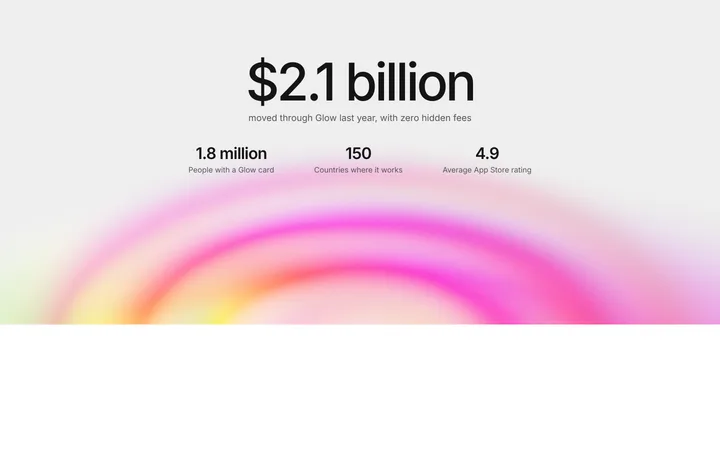
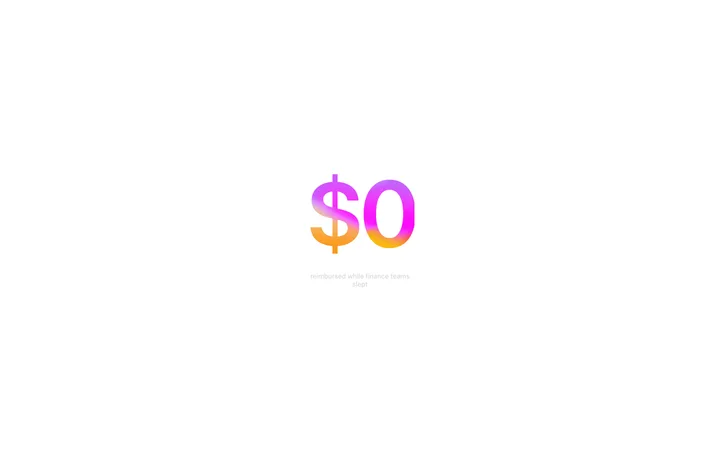
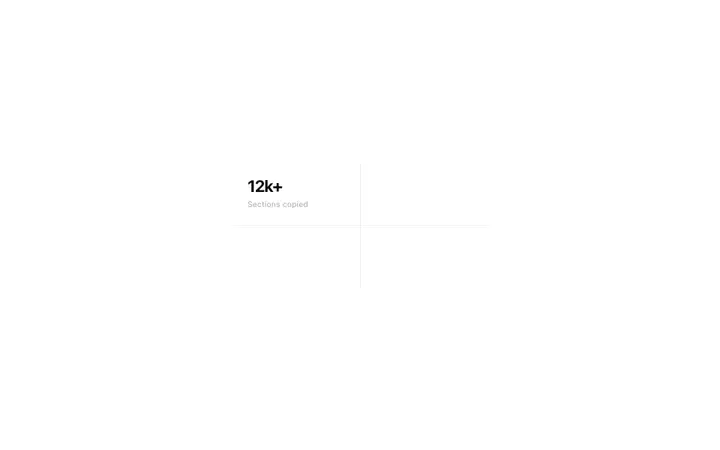
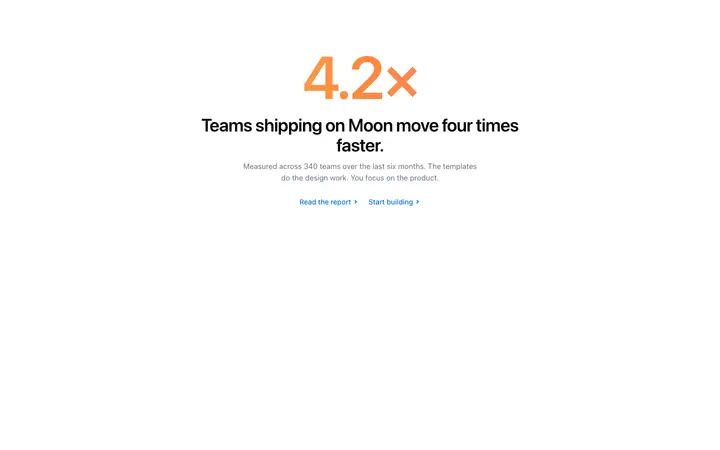
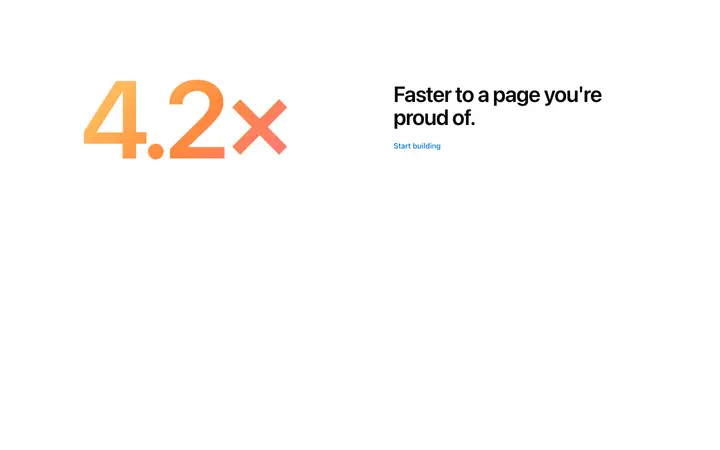
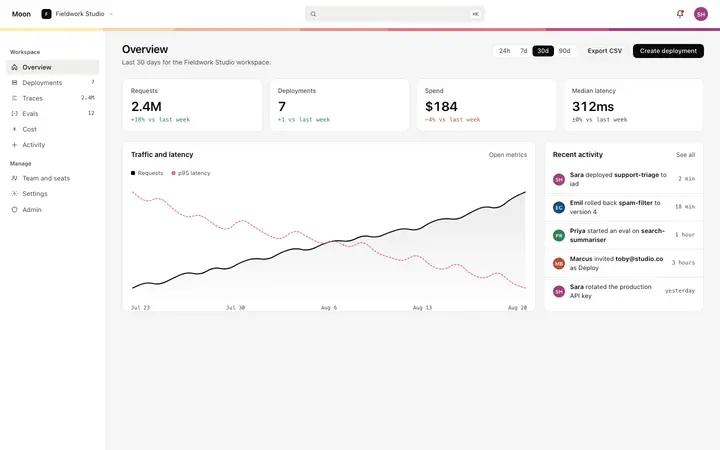
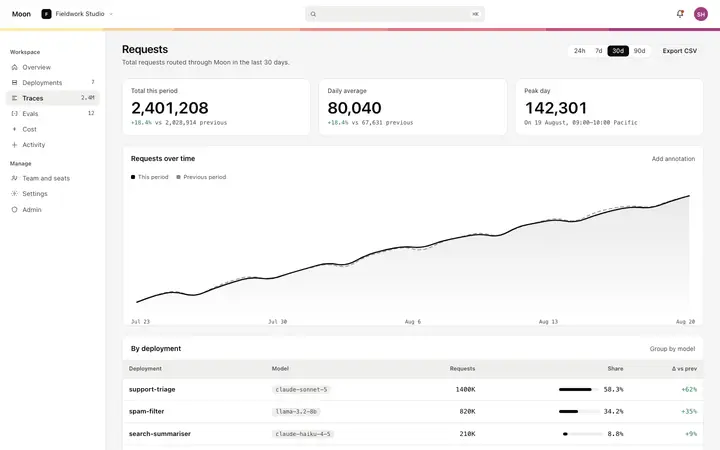
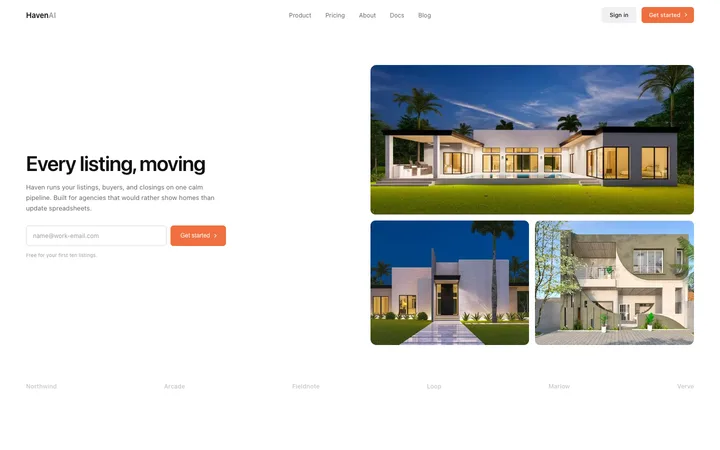
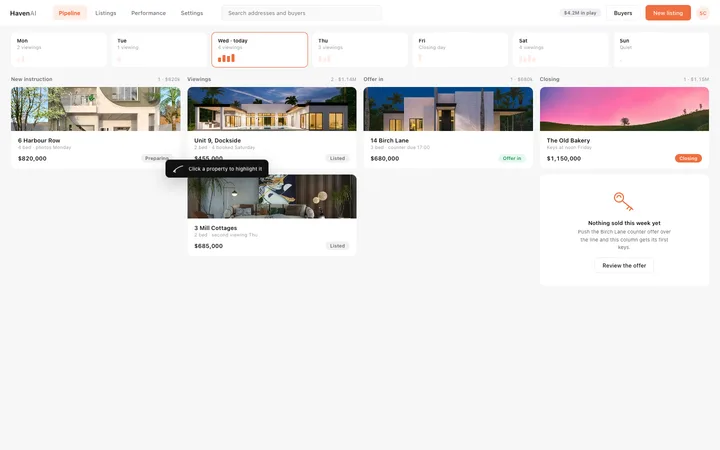
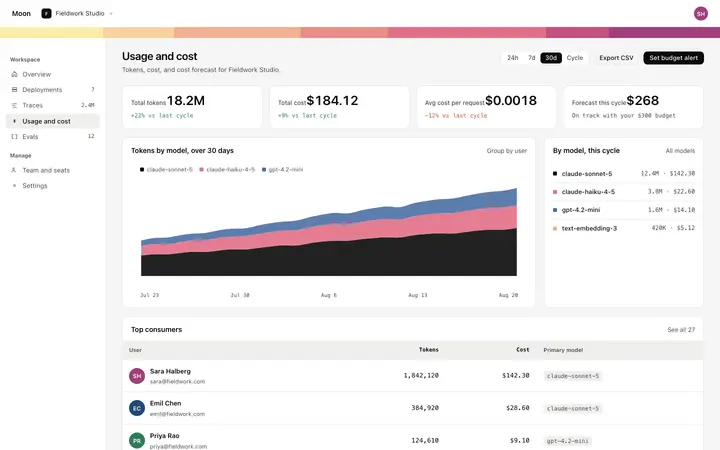
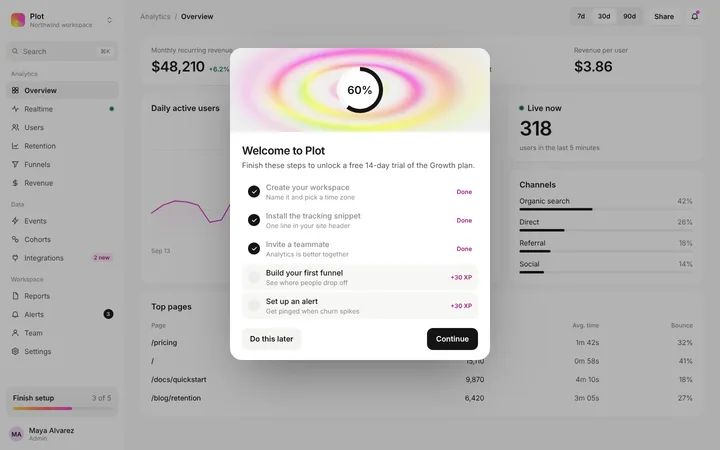
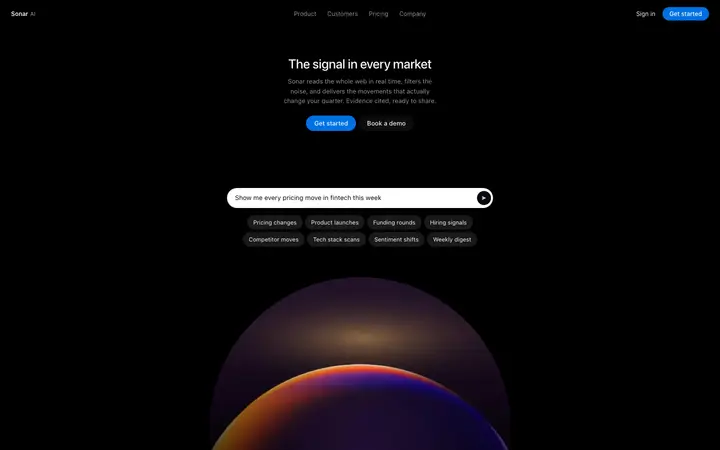
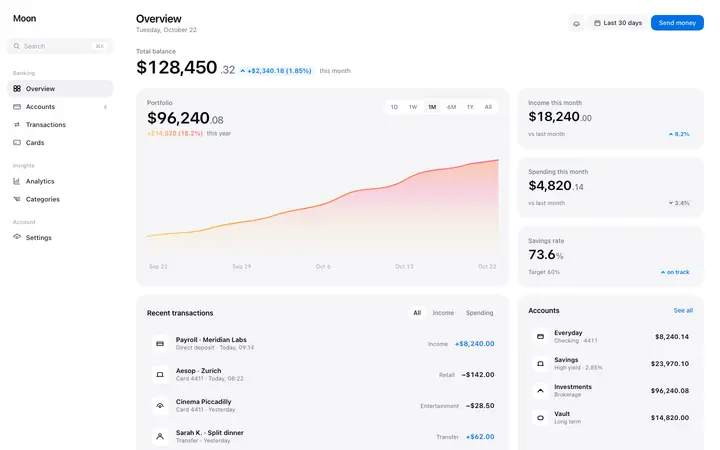
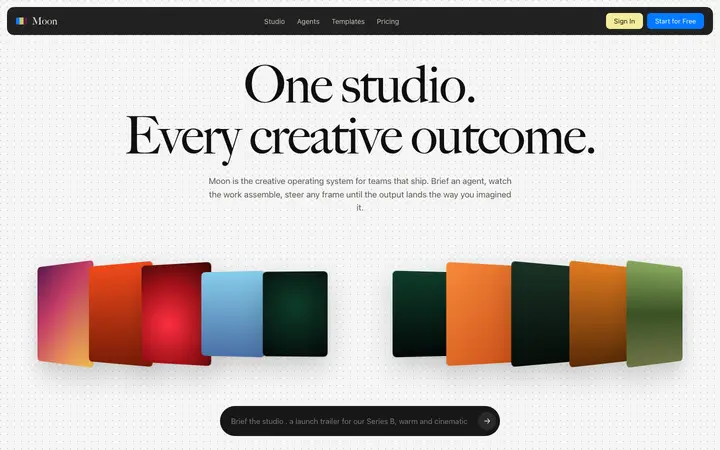
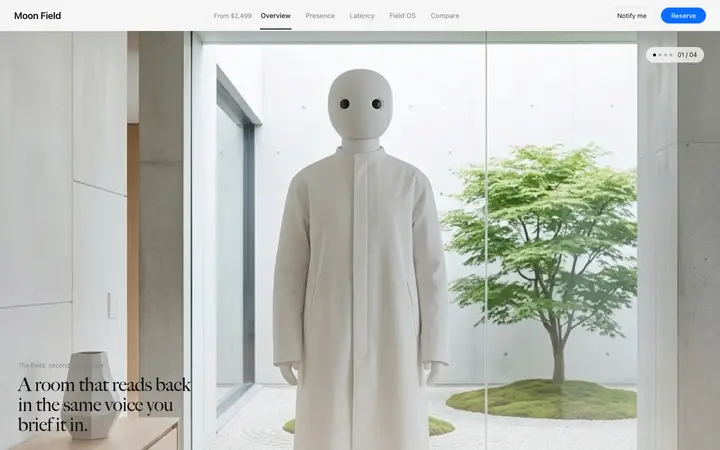

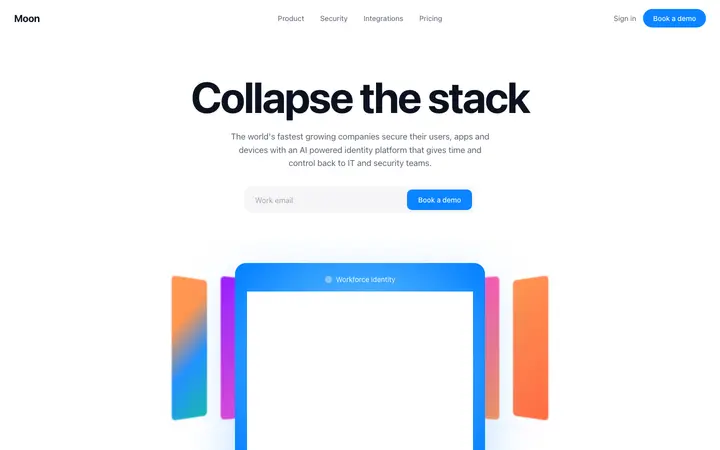
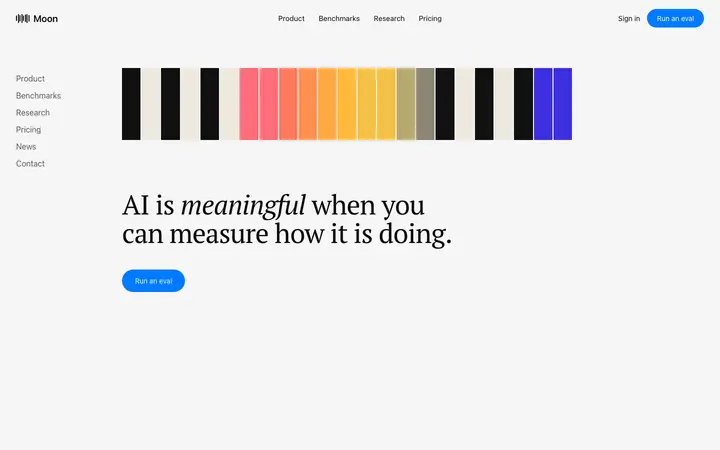
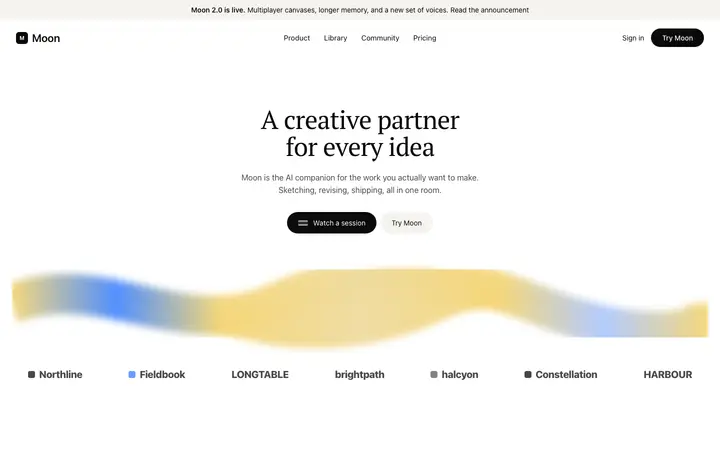
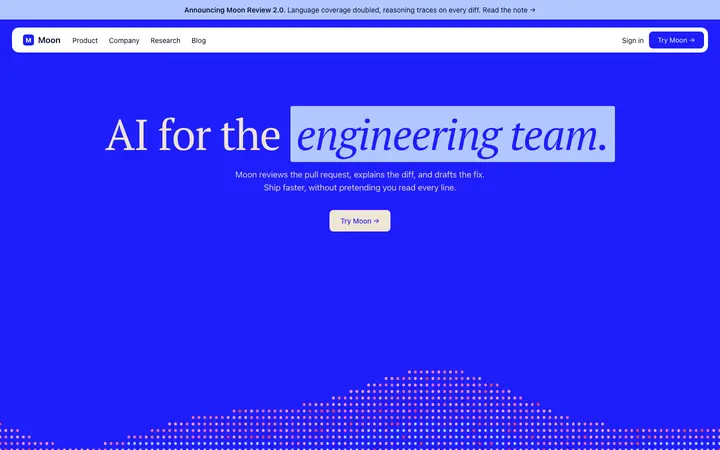
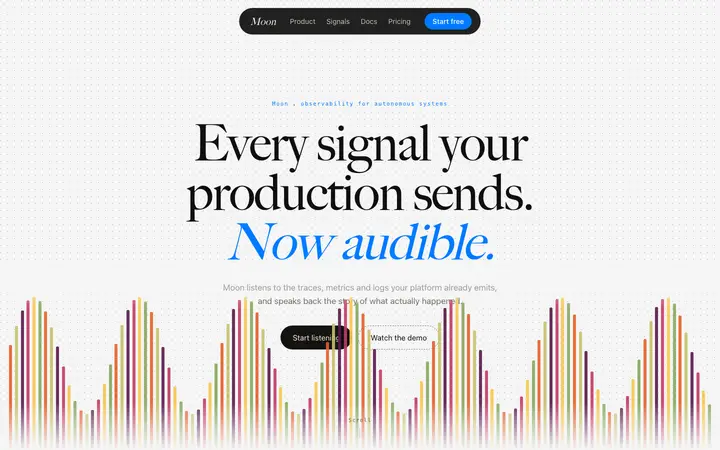
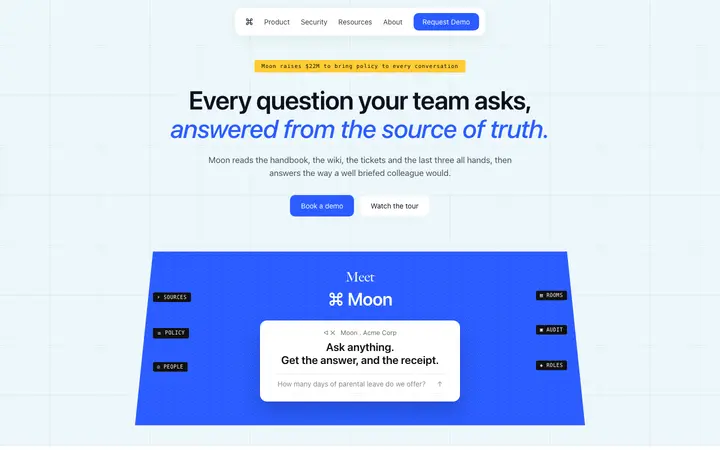
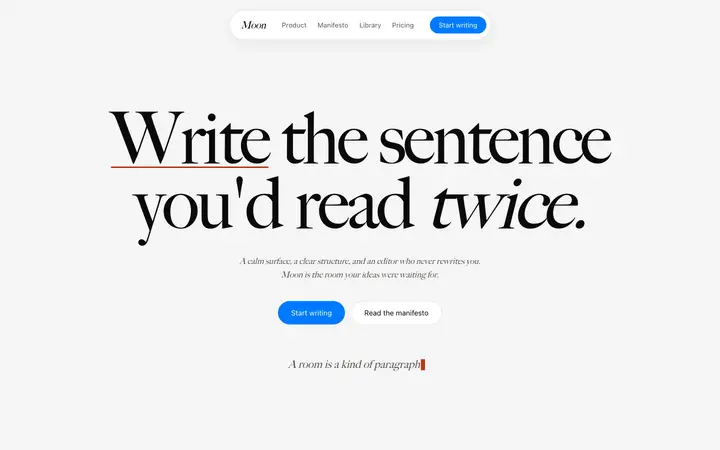
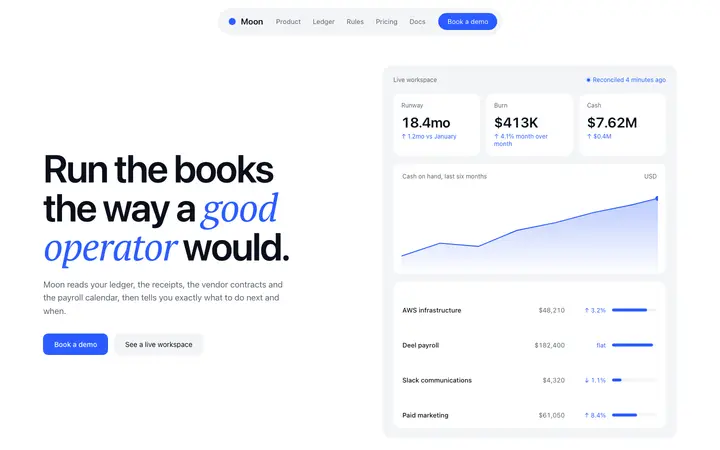
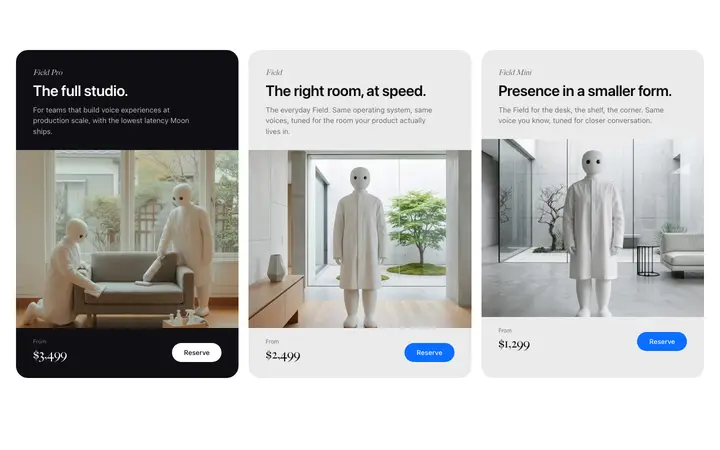
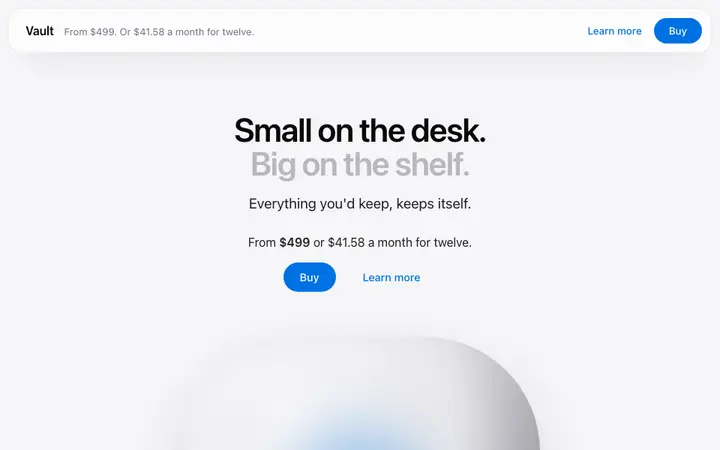
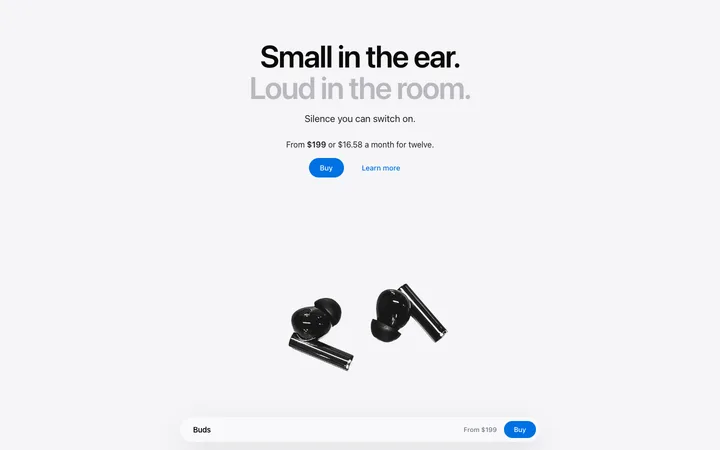
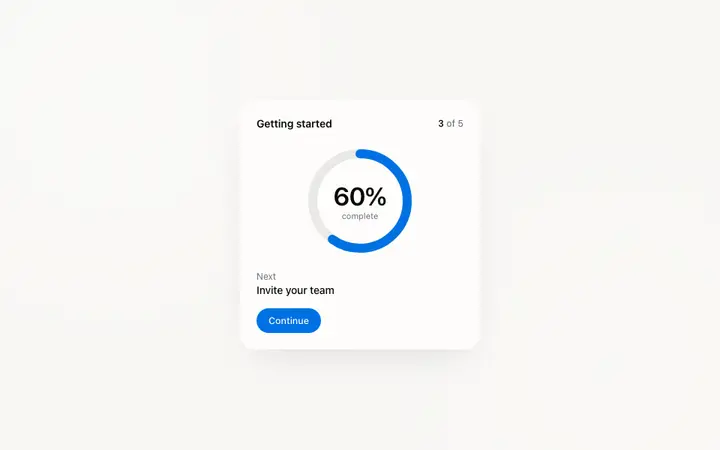
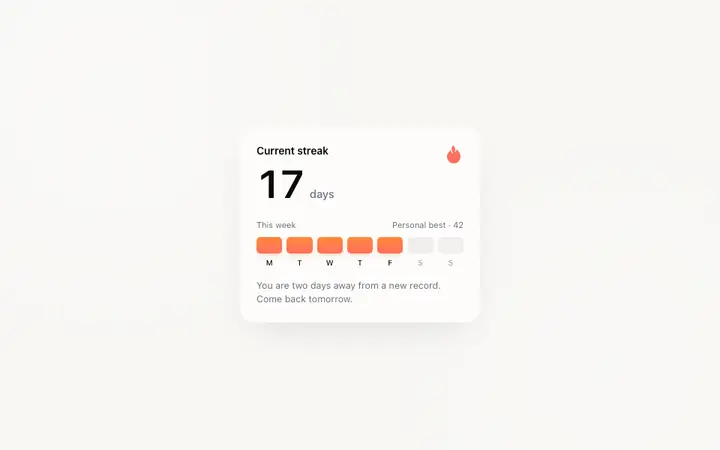
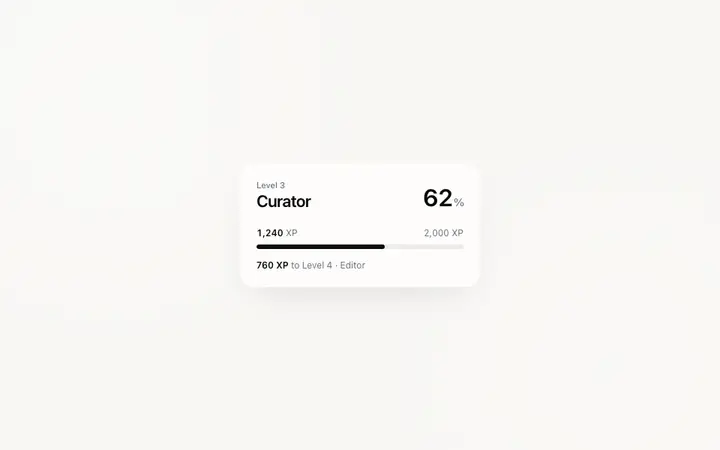
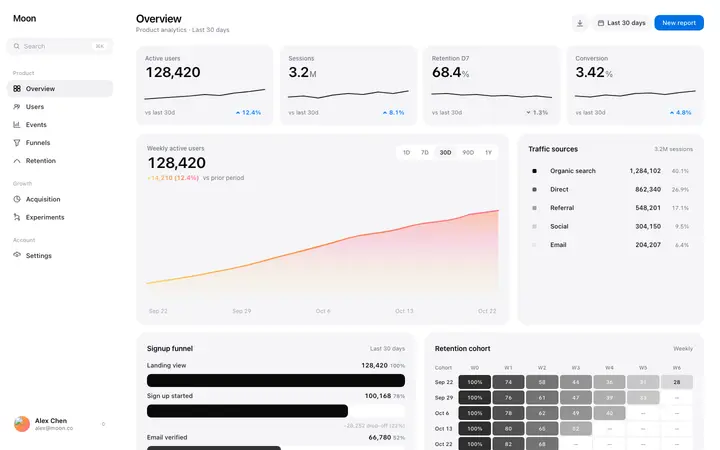
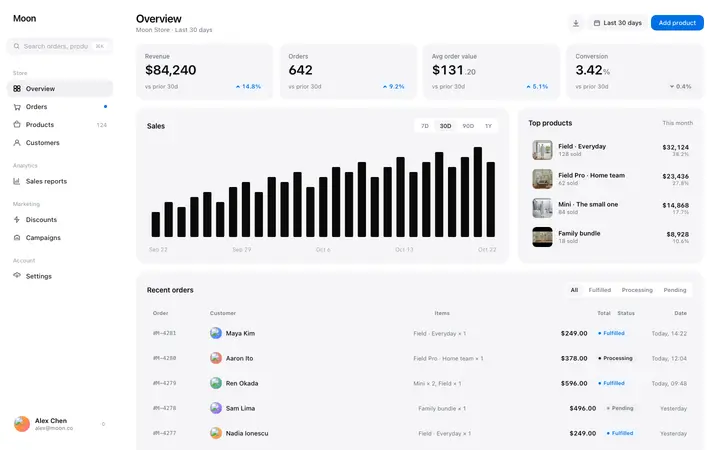
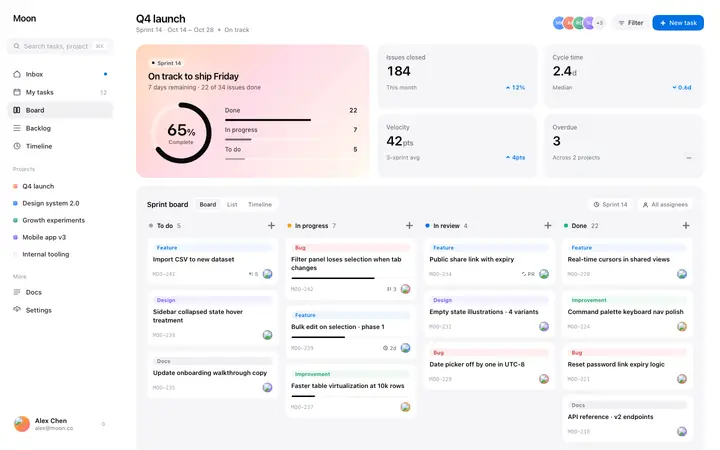
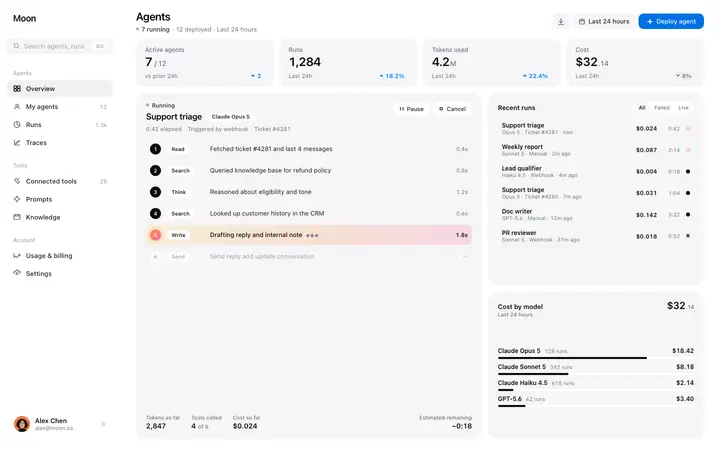
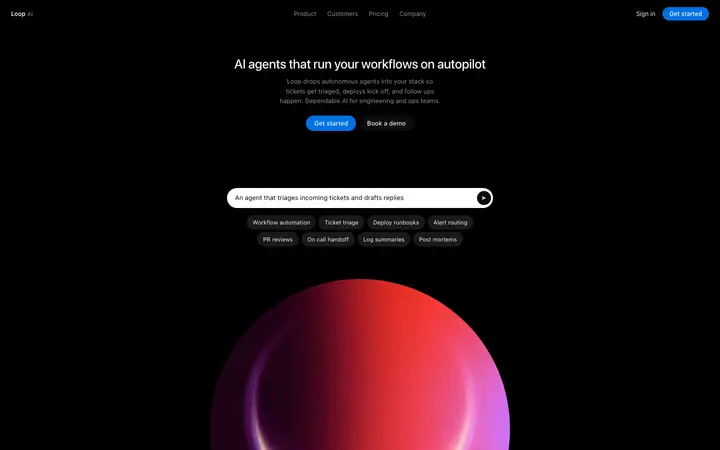
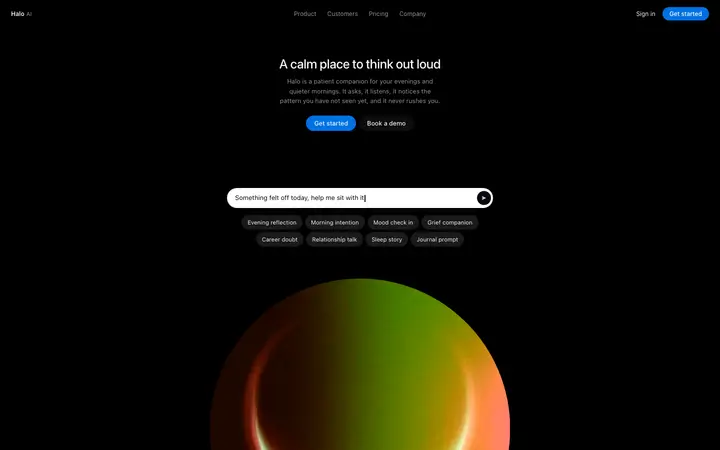
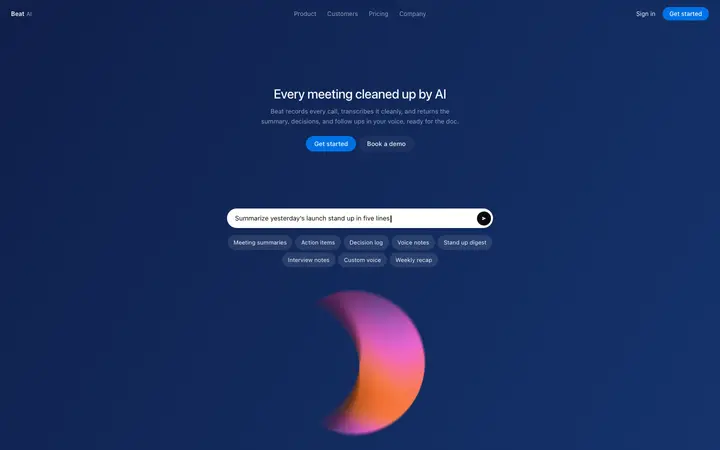
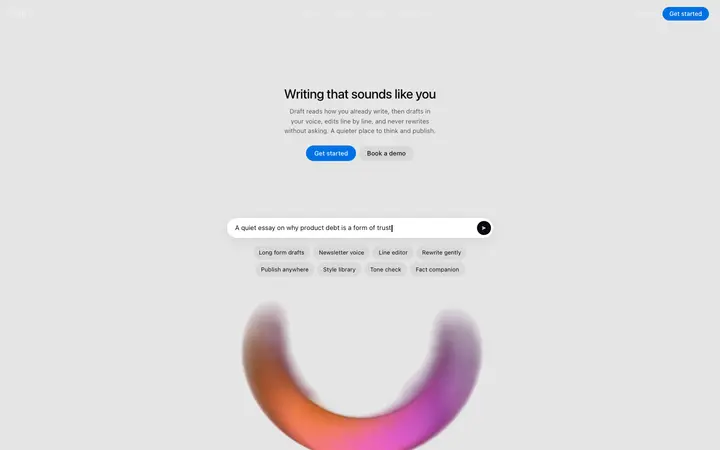
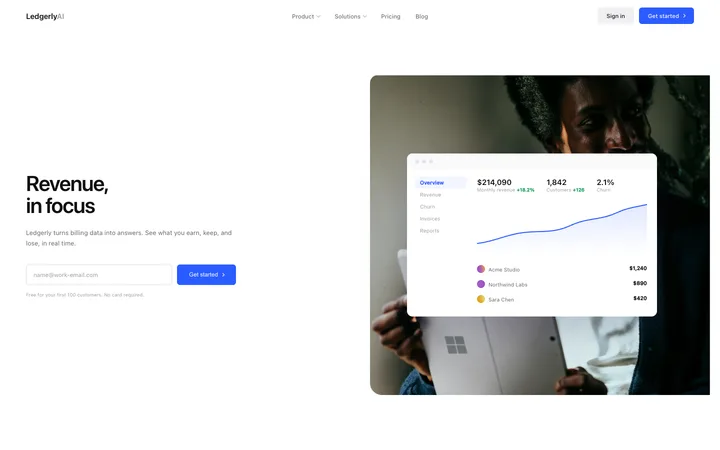
48 of 62
How to use stats templates with Lovable
Pick a design
Choose a stats design above and open it to see it live.
Copy the template
Copy the template from its page. It is one HTML file with no dependencies.
Set up Lovable
Paste the template into your first prompt and add your design rules to the project's knowledge, so every later prompt keeps the same look.
Prompt, then refine
Paste it and describe your product. Then follow up with: "Keep the exact spacing, font sizes and colours from the template I pasted. Only change the copy and the links."
What makes a good stats section
Common types: a row of big numbers, stats inside a dark band, and stats paired with a chart or a customer story.
A few big numbers
Three or four, each with a short label.
Numbers people can check
Real figures with a time frame, like "in 2026".
Placed near a claim
Stats work best right after the promise they prove.
Common mistake: Rounded vanity numbers with no context.
Keeping the design in Lovable
Lovable builds a working app from a chat, so it suits founders and designers who want a product online quickly without setting up code.
What Lovable builds
A React app styled with Tailwind CSS and shadcn/ui components.
Where the design goes
Paste the template into your first prompt and add your design rules to the project's knowledge, so every later prompt keeps the same look.
Lovable and stats sections
Lovable rebuilds the design with its own components, so spacing and fonts can shift toward its defaults. Paste the template again with your follow-up prompt if it starts to drift.
What to tell it
Keep the number size and spacing, and use real figures with a short label and time frame.
Not sure which stats design fits?
Ask Mon, the AI design assistant, describe your product and Mon suggests the stats design and how to prompt Lovable with it.
Frequently asked questions
How do I use a stats template in Lovable?
Paste the template code into your Lovable prompt as the visual baseline for your app. Paste the template into your first prompt and add your design rules to the project's knowledge, so every later prompt keeps the same look.
What does Lovable turn the template into?
A React app styled with Tailwind CSS and shadcn/ui components.
How do I stop Lovable changing the design?
Lovable rebuilds the design with its own components, so spacing and fonts can shift toward its defaults. A follow-up prompt that helps: "Keep the exact spacing, font sizes and colours from the template I pasted. Only change the copy and the links."
What makes a good stats section?
A few big numbers: three or four, each with a short label. Numbers people can check: real figures with a time frame, like "in 2026". Placed near a claim: stats work best right after the promise they prove.
Any Lovable tips for stats sections?
Lovable rebuilds the design with its own components, so spacing and fonts can shift toward its defaults. Paste the template again with your follow-up prompt if it starts to drift.
More Lovable template categories
Stats templates for other tools